
5L3.40 Organise and represent simple information
Workbooks
Input data into spreadsheets and select the most appropriate way to represent the information.
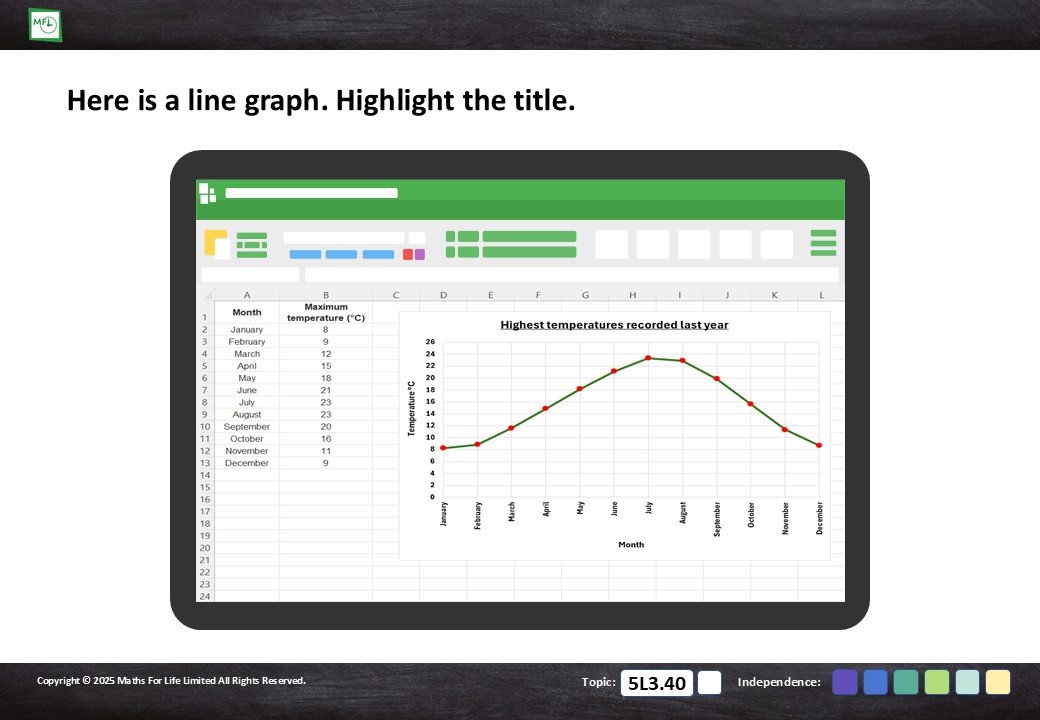
Properties of charts and graphs
Introduction to bar charts, line graphs and pie charts and their properties.
15 pages
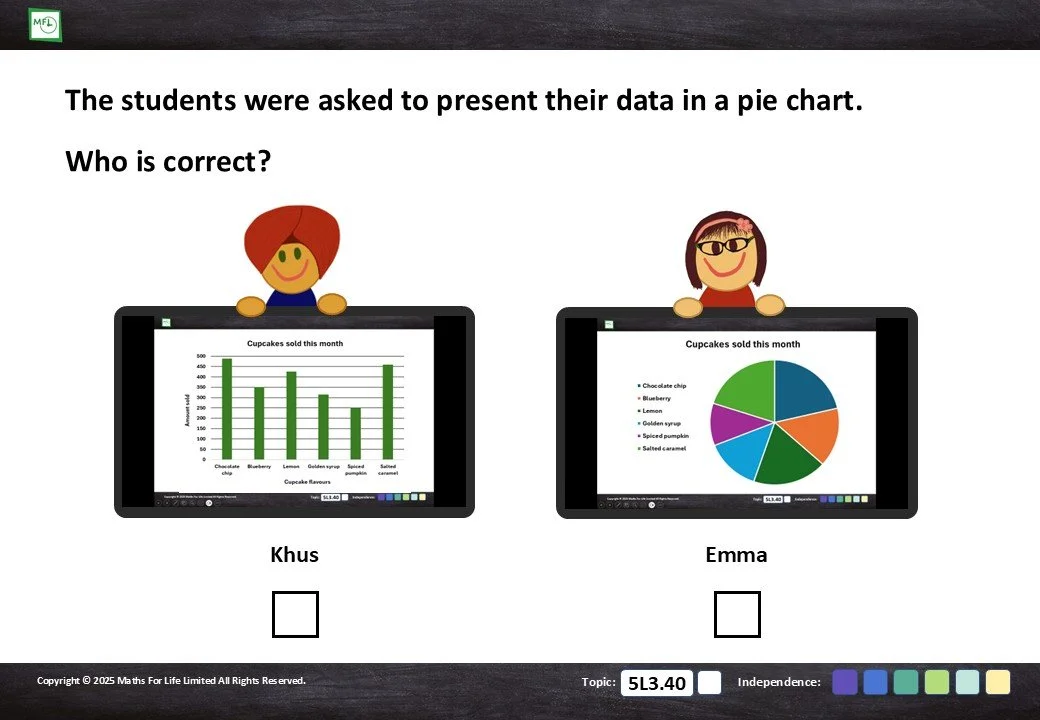
Discuss and identify the most appropriate different way to represent data.
30 pages
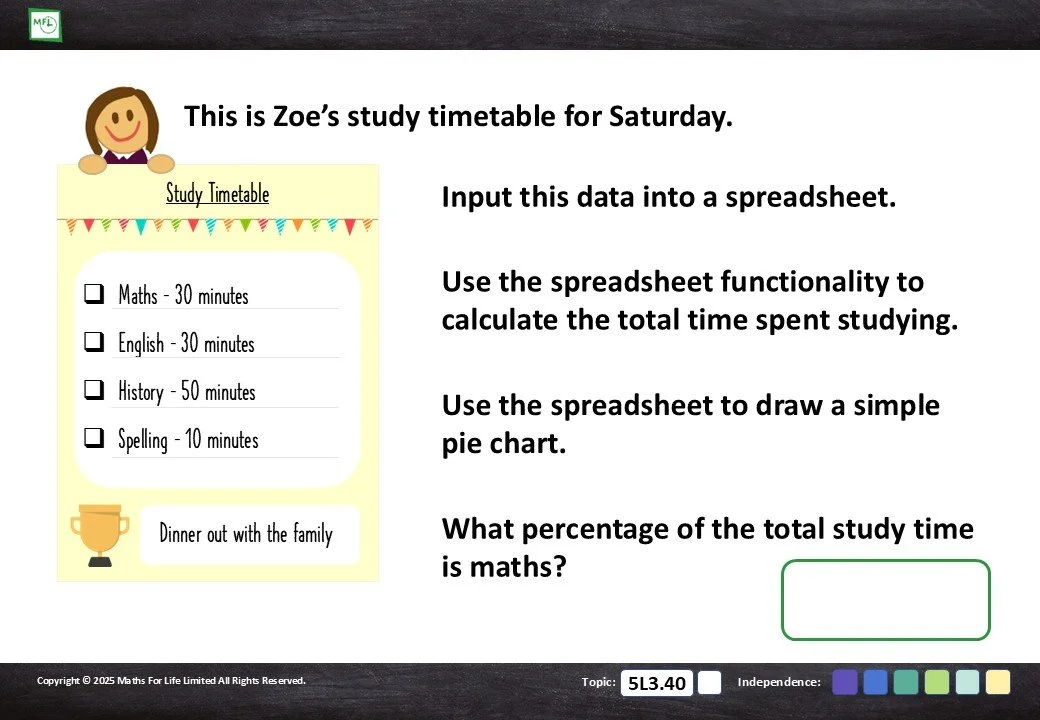
Use data from a variety of scenarios to input into spreadsheets and create the most appropriate charts and graphs.
36 pages