Level 5 - Topic 3

Statistics is the formal name for handling information and data and it is a very important part of maths in life - from reading bus and train timetables to making shopping lists, from working out the best mobile phone plan to analysing electricity usage over the year. This page contains all Level 4 workbooks, resources and templates currently published relating to Topic 3 - Handling Information and Data.

TOPIC 3 - HANDLING INFORMATION AND DATA


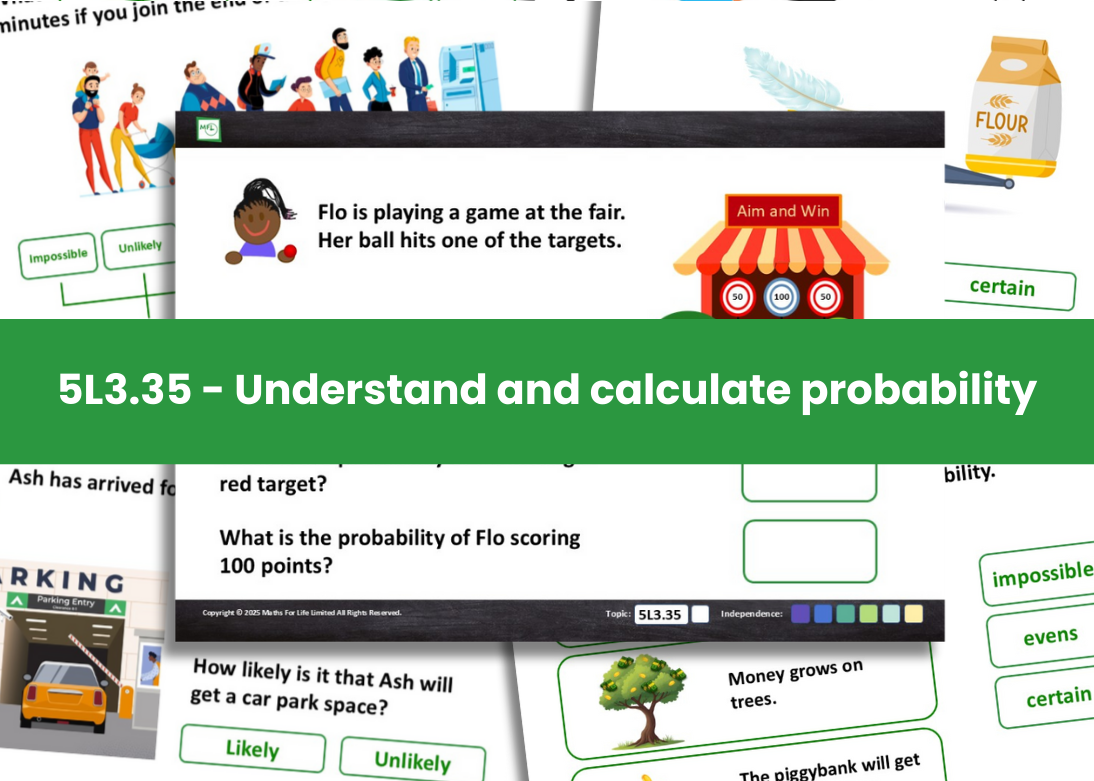
5L3.35 Understand and calculate probability

Impossible or certain WORKBOOK - This 20-page workbook is a great introduction to understanding probability. With a range of real-life examples, students are asked to select whether the probability of an event/situation happening is impossible or certain. [Eco Ink Version]

Impossible, evens or certain WORKBOOK - This 10-page workbook introduces the concept of ‘evens’ in relation to probability. With 3 examples per page, students are asked to select whether the probability of an event/situation happening is impossible, evens or certain. [Eco Ink Version]

Likely or unlikely WORKBOOK - This 20-page workbook is a perfect example of why we don’t publish answers at Maths For Life! Enjoy the conversations that this workbook sparks as you explore the concept of likelihood with your students. [Eco Ink Version]

Probability word line WORKBOOK - This 30-page workbook consolidates the learning from the previous 3 workbooks and asks students to mark probability on a word line. With examples such as ‘the probability of brushing your teeth tonight’ to ‘the probability of becoming a professional YouTuber’ - get ready for lots of debate! [Eco Ink Version]

Raffle ticket WORKBOOK - This 32-page workbook explores the next stage of probability - calculations. Using raffle tickets as a real-life example, the workbook begins by repeating the desired outcome and increasing the possible outcomes for the first 12 questions, before progressing in difficulty. [Eco Ink Version]

Calculating probability WORKBOOK - This 30-page workbook uses a range of scenarios to enable students to practise their probability calculations, including fruit from the fruit bowl, targets at a fairground stall and the chances of picking a square biscuit from the biscuit tin. Ideas which could easily be recreated in real life! [Eco Ink Version]


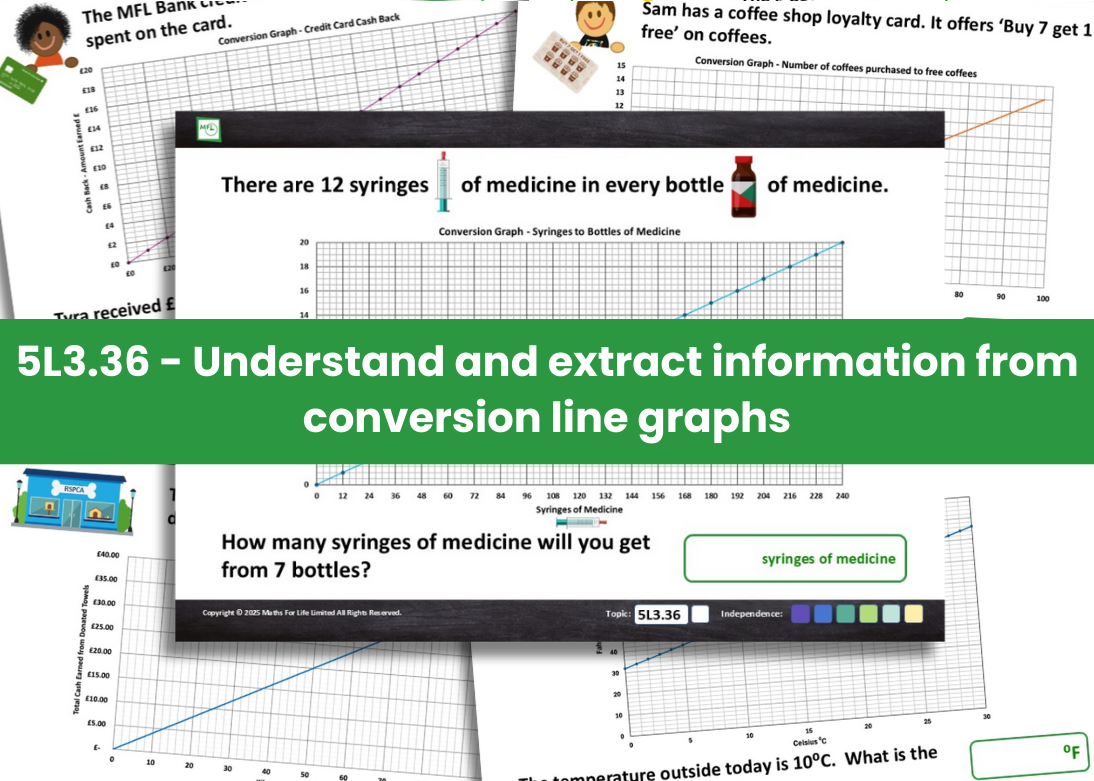
5L3.36 Understand and extract information from conversion line graphs

Extracting information from conversion line graphs WORKBOOK - This 28-page workbook helps the student to understand and extract information from simple conversion line graphs. There are seven different examples of conversion line graphs with four questions on each of them. [Eco Ink Version]


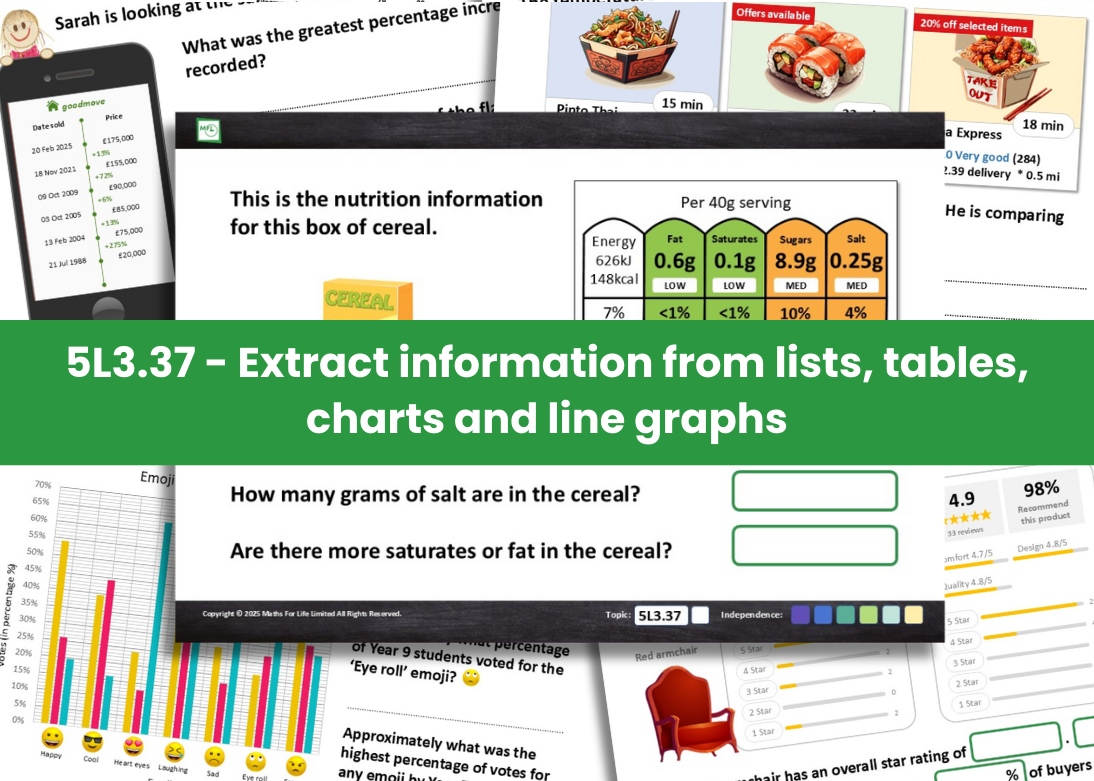
5L3.37 Extract information from lists, tables, charts and line graphs with whole and decimal numbers

Extracting information from a list WORKBOOK - In this 15-page workbook, students are presented with a range of lists involving decimal numbers and percentages which you would find in the real world, including property valuations and order forms. [Eco Ink Version]

Extracting information from a table WORKBOOK - This 20-page shopping themed workbook requires students to extract information from tables, carry out calculations and make choices about products based on their answers. Skills which are used every day in online shopping. [Eco Ink Version]

Extracting information from a diagram WORKBOOK - We extract mathematical information from diagrams every day, sometimes without even knowing it. In this 20-page workbook, students can develop these skills through a range of diagrams, including maps, food delivery options and nutrition labels. [Eco Ink Version]

Extracting information from a bar chart WORKBOOK - In this 15-page workbook, students are presented with a range of bar charts involving decimal numbers and percentages representing statistics from the real world, including emoji usage and pet population. [Eco Ink Version]

Extracting information from a line graph WORKBOOK - In this 20-page workbook, students are presented with a range of line graphs involving decimal numbers and percentages representing statistics from the real world, including price inflation and projected population. [Eco Ink Version]


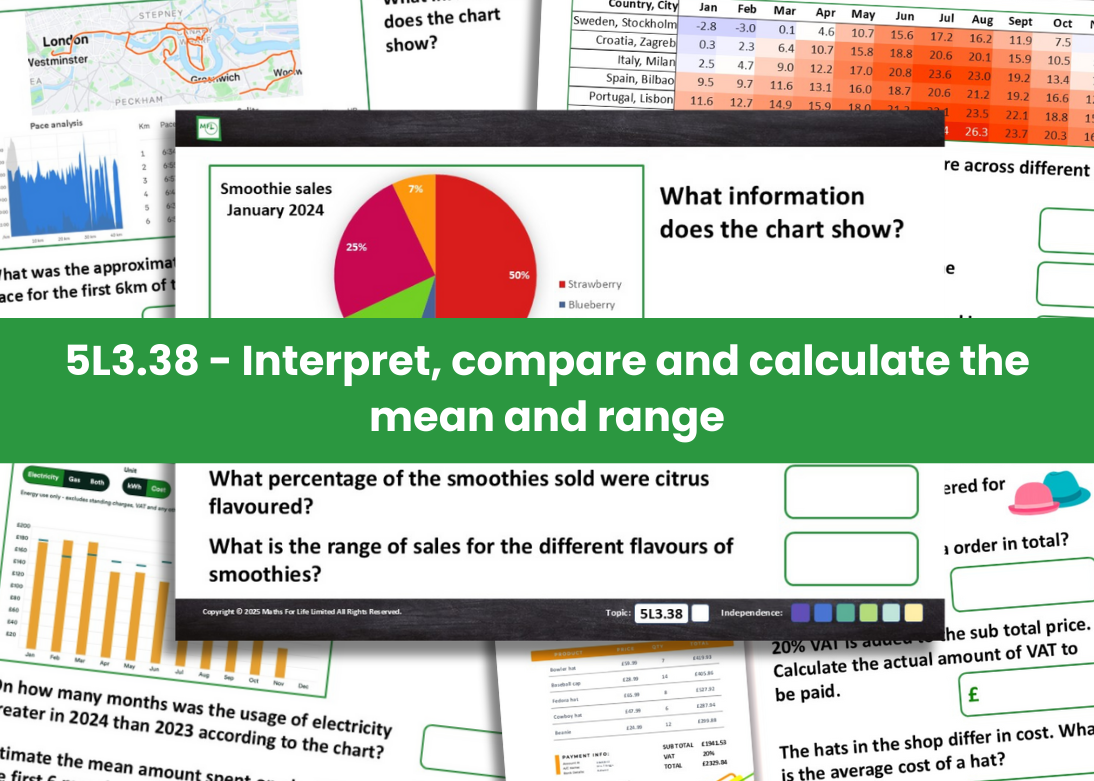
5L3.38 Interpret information, make comparisons, calculate the mean and range of data

Interpreting information WORKBOOK - This 20-page workbook looks at interpreting information from a variety of different real-life sources, including lists (invoices), graphs (energy usage) and diagrams (fitness). Students are asked to interpret and compare the relevant data as well as find the mean and range. [Eco Ink Version]


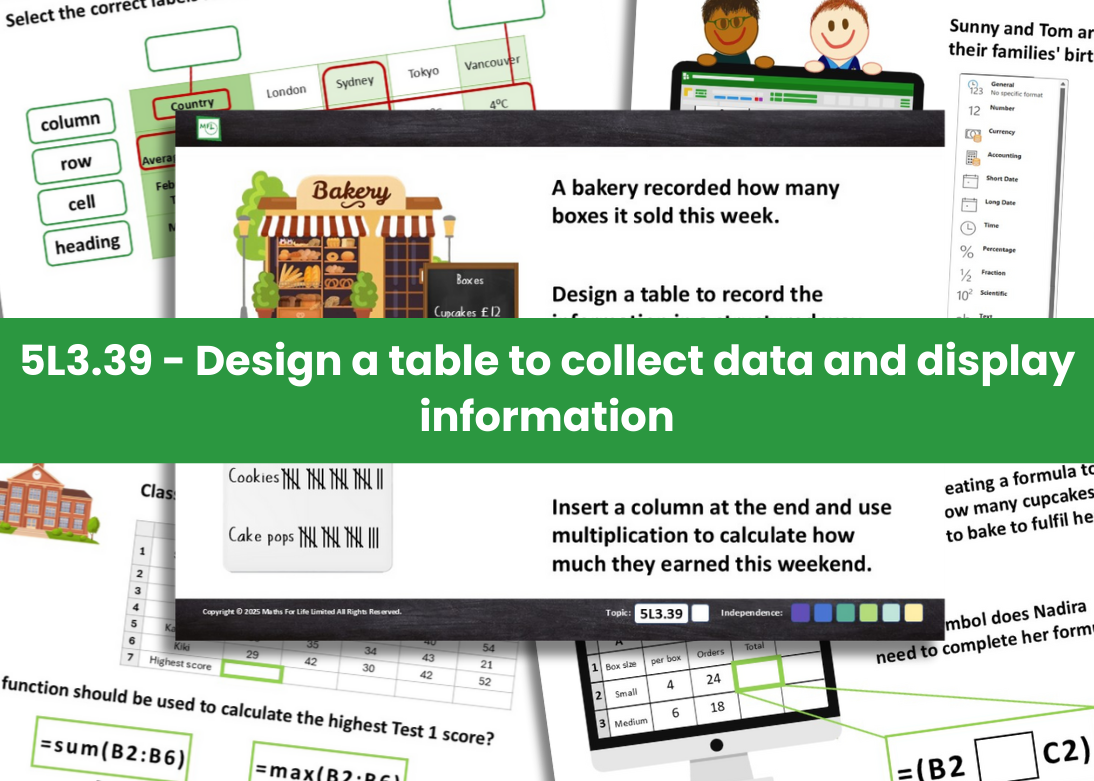
5L3.39 Design a table to collect data and display information

Identifying cells in a spreadsheet WORKBOOK - This 18-page workbook looks at the understanding of a cell in a spreadsheet, the naming and location. [Eco Ink Version]

Identifying the properties of a spreadsheet WORKBOOK - This 20-page workbook looks at the identification of cells, headings, rows and columns in a spreadsheet, the naming and location. [Eco Ink Version]

Organisation of information into a spreadsheet WORKBOOK - This 18-page workbook looks at the most appropriate location to input a given piece of information into an existing spreadsheet. [Eco Ink Version]

Formatting a cell WORKBOOK - This 20-page workbook looks at selecting the most appropriate format for a cell given the information provided. Visuals and names from different spreadsheet packages are used. [Eco Ink Version]

Calculating a cell contents WORKBOOK - This 32-page workbook looks at how to create a calculation on a spreadsheet, taking information from one / several cells and using it to calculate the output of another cell. [Eco Ink Version]

Understanding a Function WORKBOOK - This 15-page workbook looks at using ‘Functions’ of a spreadsheet to do calculations and derive additional information from data. [Eco Ink Version]

Understanding a Formula WORKBOOK - This 30-page workbooks looks at using a ‘Formula’ in a spreadsheet to do calculations and derive additional information from data. [Eco Ink Version]


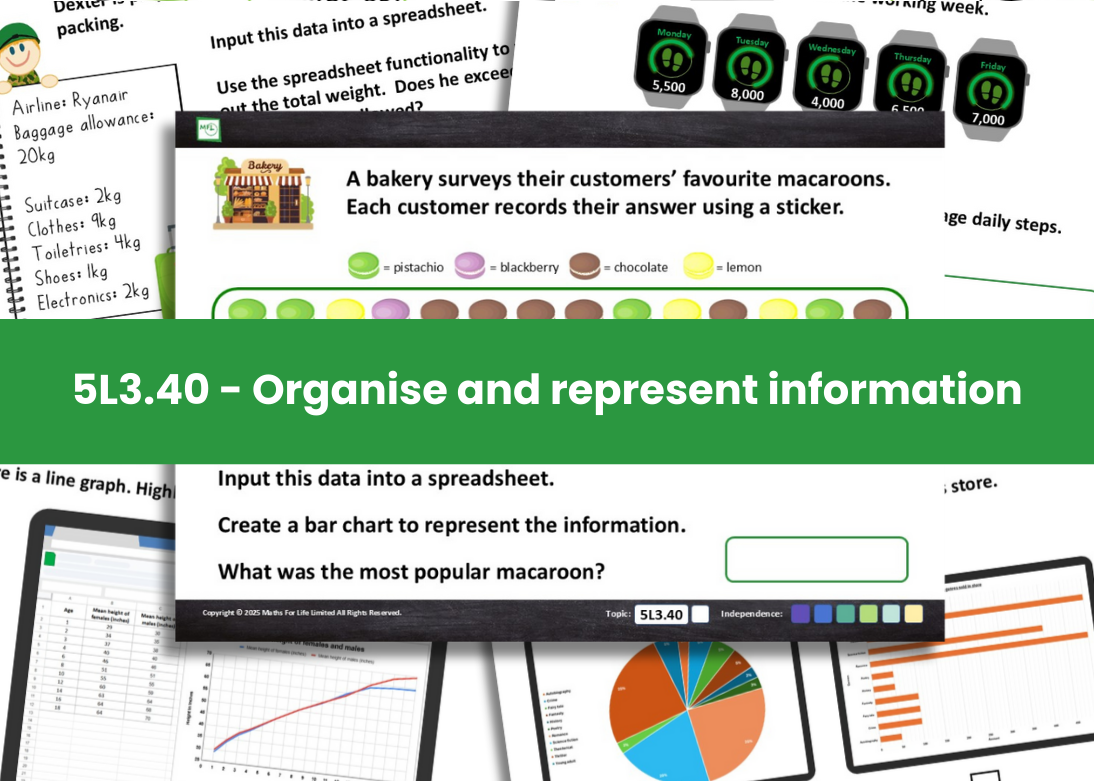
5L3.40 Organise and represent information in appropriate ways

Properties of charts and graphs WORKBOOK - This 15-page workbook offers an introduction to bar charts, line graphs and pie charts and their properties, including titles, axis labels and keys. [Eco Ink Version]

Presenting data WORKBOOK - This 30-page workbook looks at different ways to present data and provides the opportunity for students to discuss the most appropriate method of presenting the data given. [Eco Ink Version]

Creating charts and graphs WORKBOOK - In this 36-page workbook, students are provided with data from a variety of scenarios and are asked to create the appropriate charts and graphs using spreadsheets. [Eco Ink Version]


Small steps, bright future.