4L3.36 Organise and represent information
Workbooks
Organise and represent simple information in appropriate ways, including frequency tables and pie charts.
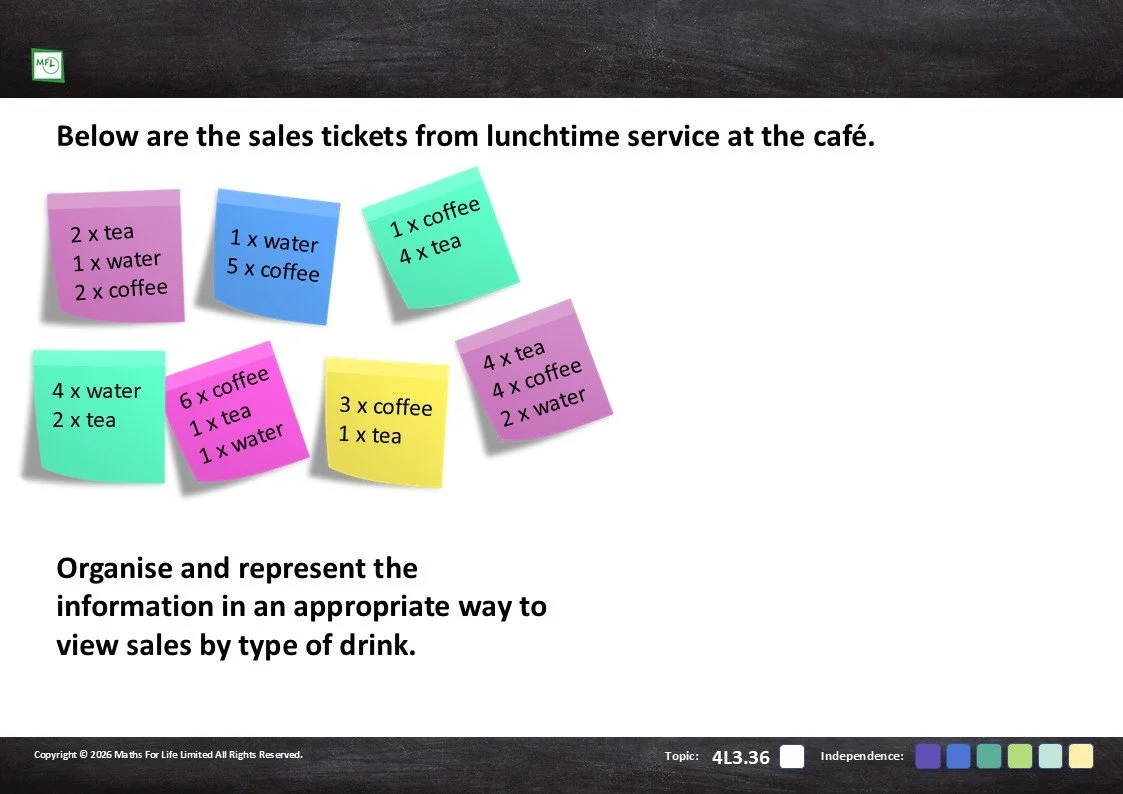
Organise and represent the given data in the most appropriate format from a variety of everyday situations.
26 pages
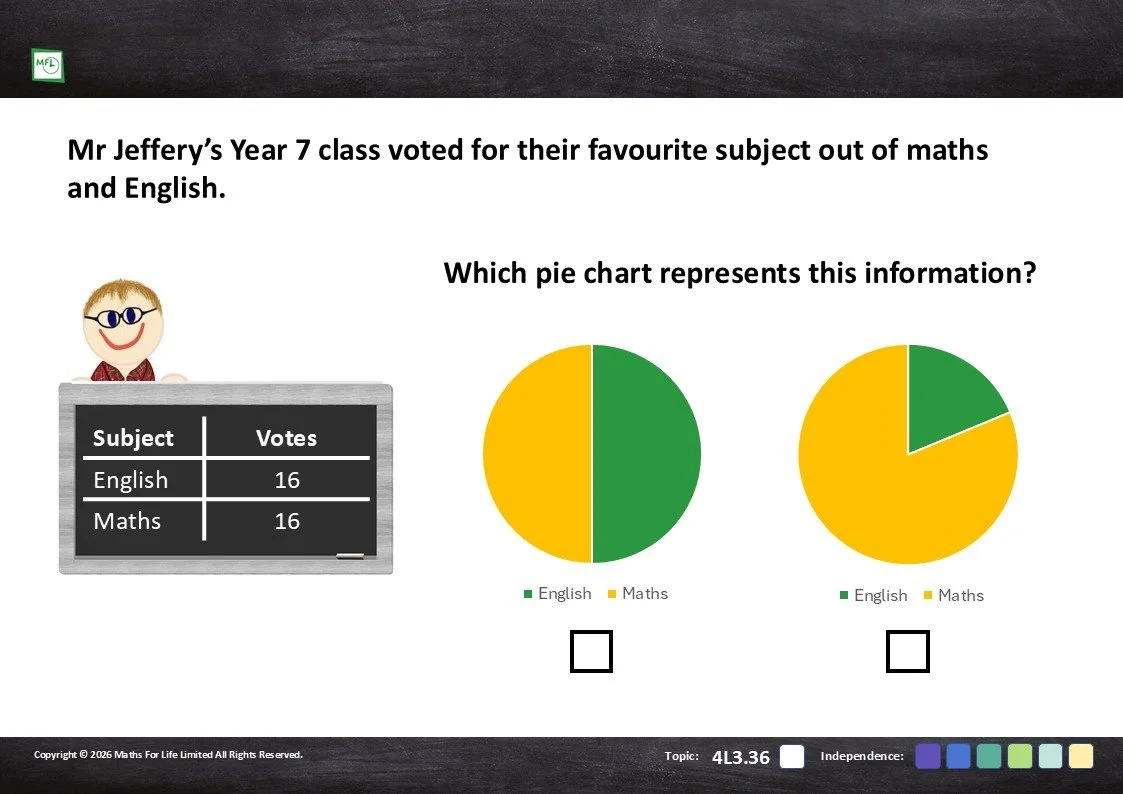
Understand and create pie charts
Understand information represented in the given pie charts, before creating your own.
11 pages
Templates and activities
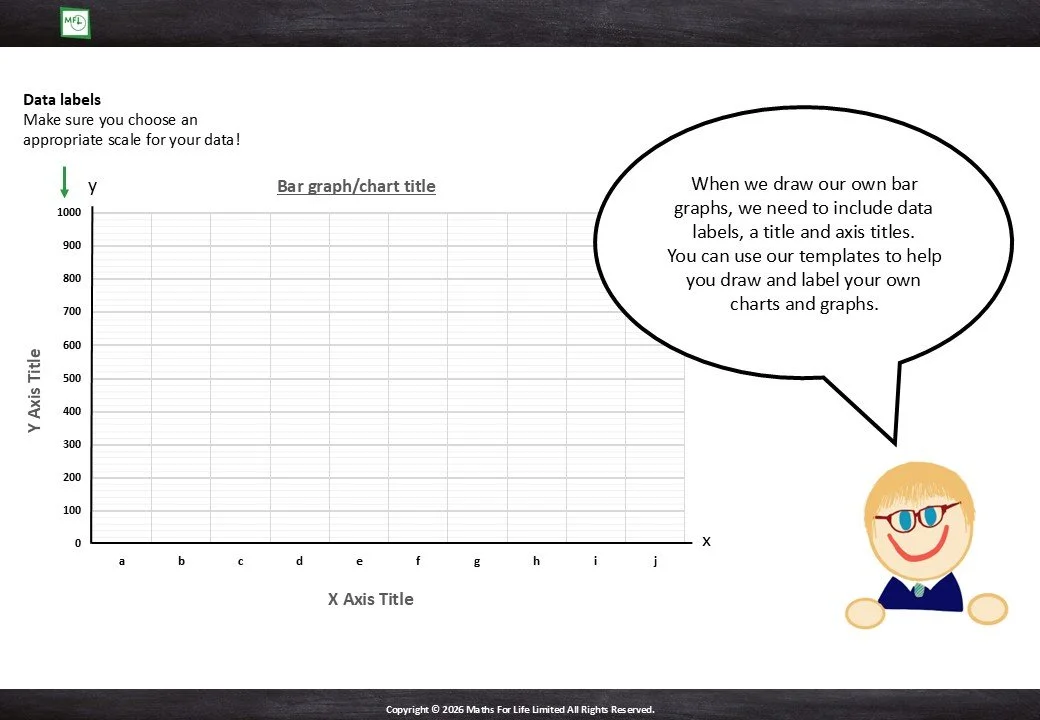
Lance provides guidance on drawing your own bar graphs/charts in this handy information sheet.
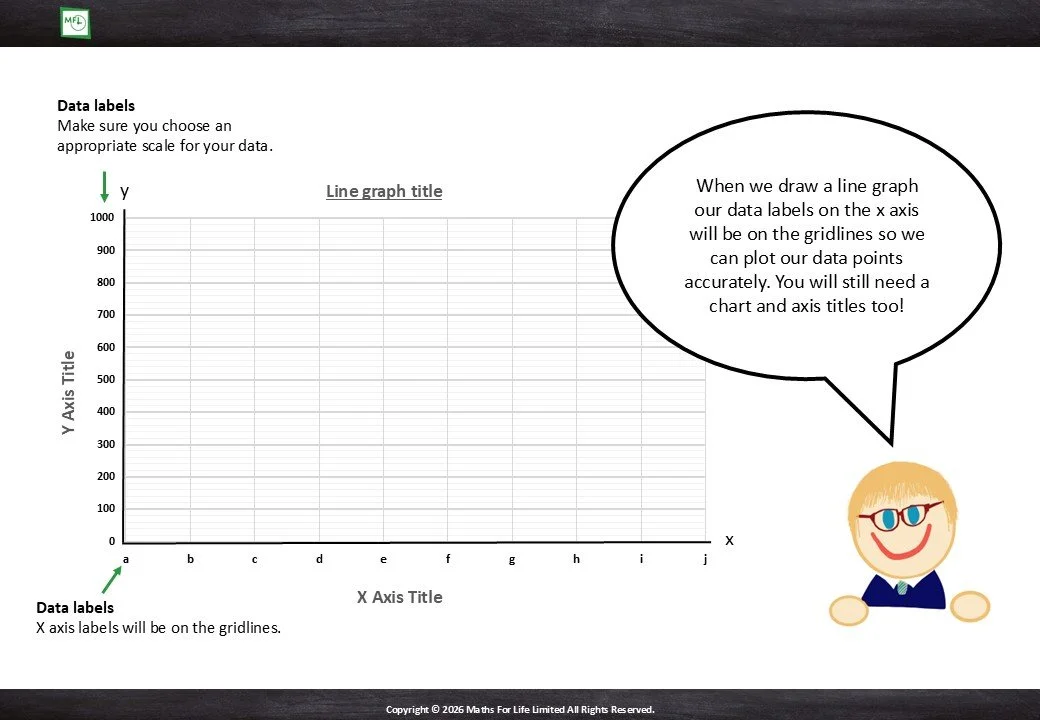
Lance provides guidance on drawing your own line graphs in this handy information sheet.
2 pages